Graphs
Factors 1 & 2
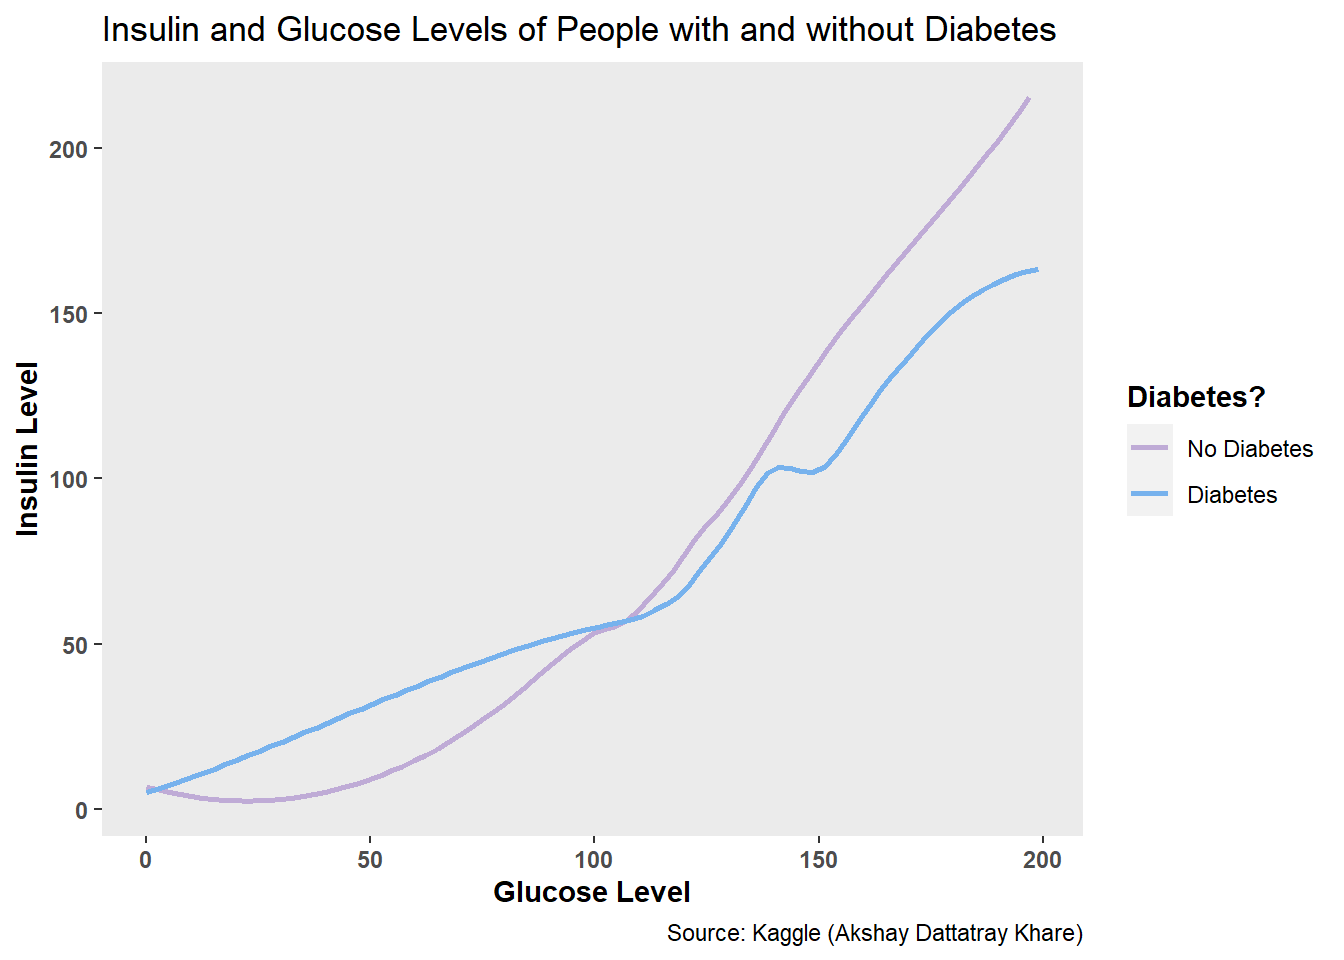
Among individuals with glucose levels below 100 in this sample, diabetic patients have higher insulin levels compared to non-diabetic patients. However, for individuals with glucose levels exceeding 100, diabetic patients show lower insulin levels in comparison to non-diabetic patients, indicating a potential impairment in glucose regulation among individuals with diabetes.
Factor 3
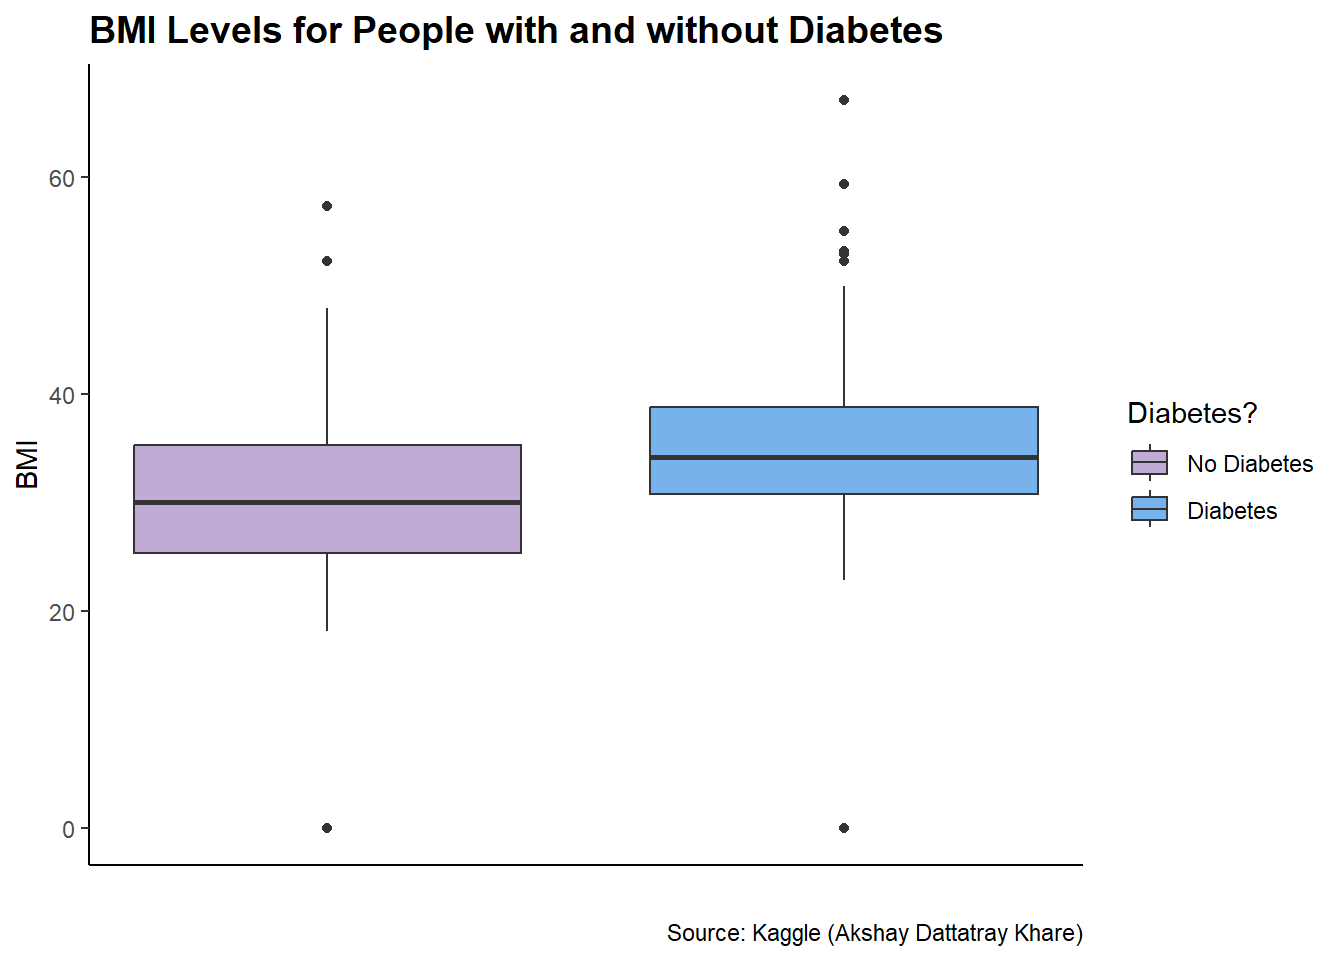
The higher position of the boxplot for the diabetes group suggests a correlation between diabetes and higher BMI levels as there would be a disruption in glucose metabolism.
Factor 4

The boxplot for the diabetes group is only slightly higher than that of the non-diabetes group which suggests a weak correlation between diabetes and blood pressure levels. There could be other factors that play a more significant role in influencing blood pressure outcomes.